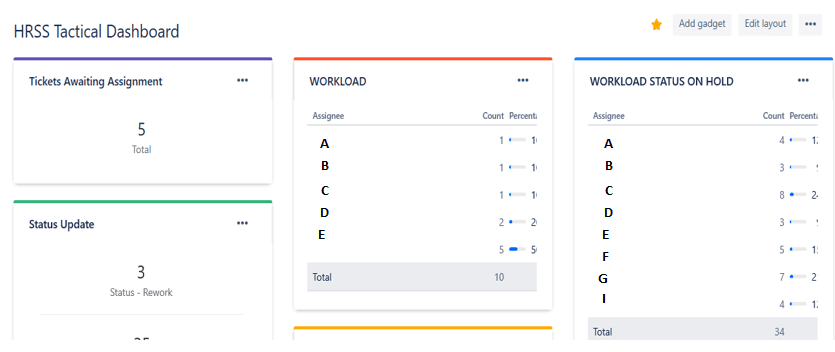
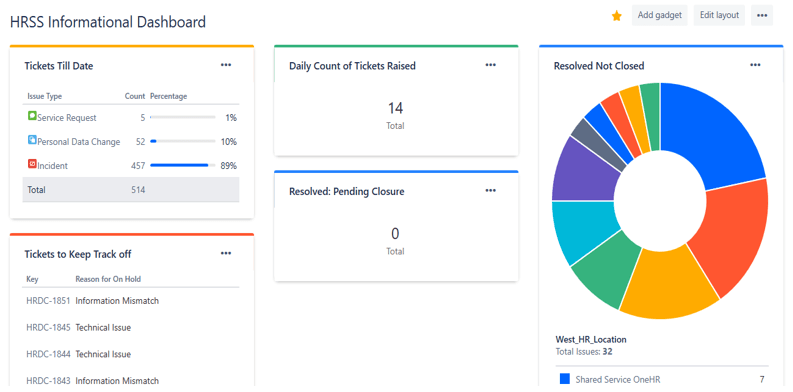
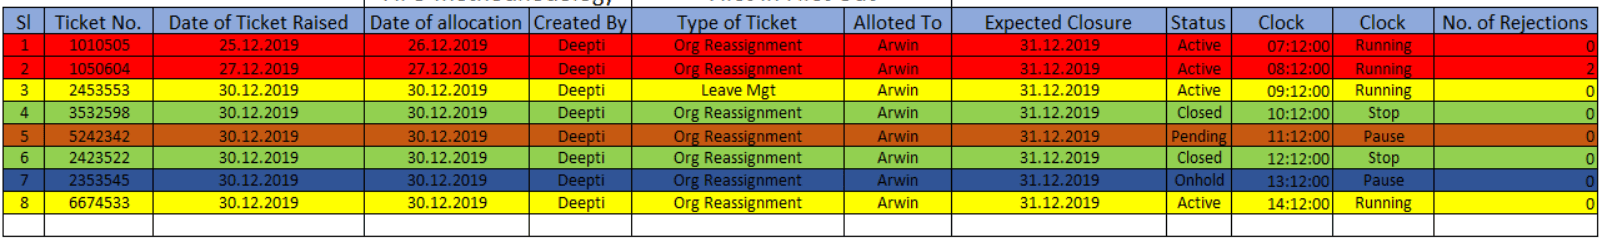
I had no idea on JIRA Dashboard and Filters, tried My best to outlined basic dashboard which would provide some information for HR Shared Service Daily workaround. Here it is below & also we would see modified, advanced dashboards as and when we progressed.
Dashboard in JIRA is always associated with Filters, In order to create Dashboard, first we need to create filters for the required inputs which would help us to build Dashboards
How to create a Filter in JIRA ?
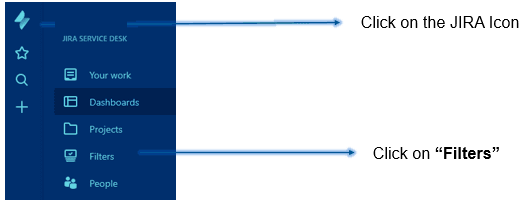
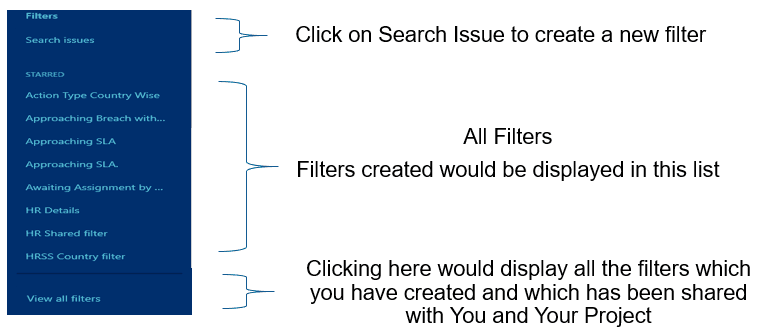
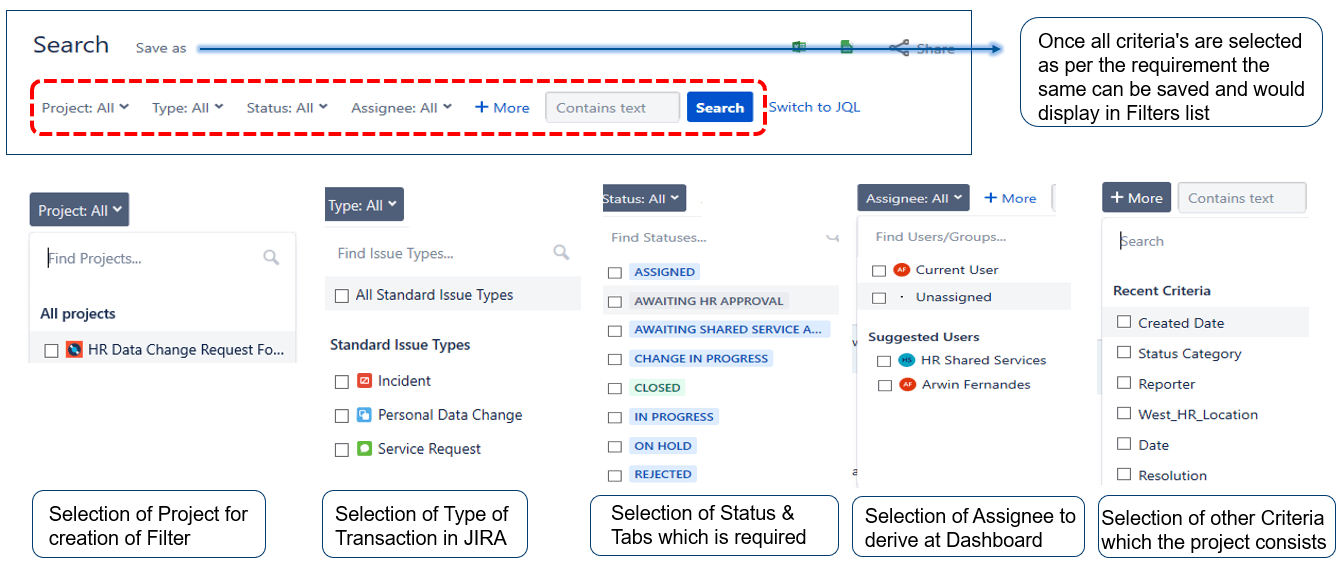
As shown above using all various pointers and variable, JIRA allows us to build a Filters which would pull out data as required.
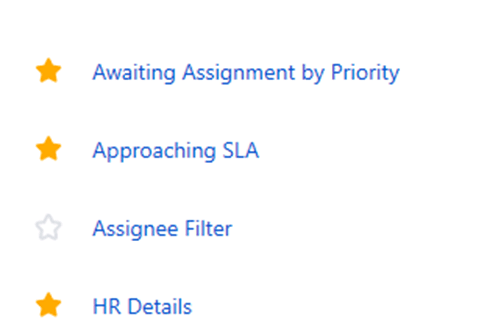
How to Add Filter to Favorites ?
If You want the filter to be used for Dashboard, then its necessary to click on Star and keep it on so that the filter would be displayed while creating Dashboard
When a person shares a Dashboard or a Filter, the Dashboard would not show the data unless you select Star for the filter which has been shared
How to Share Filter with Project or with Individual ?
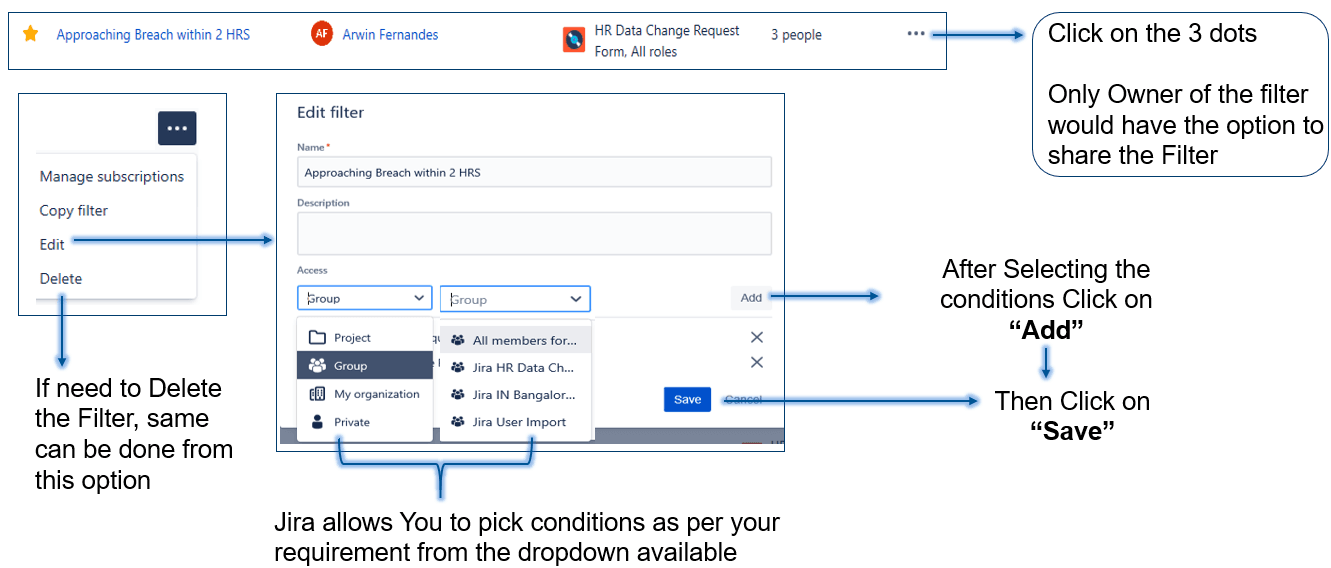
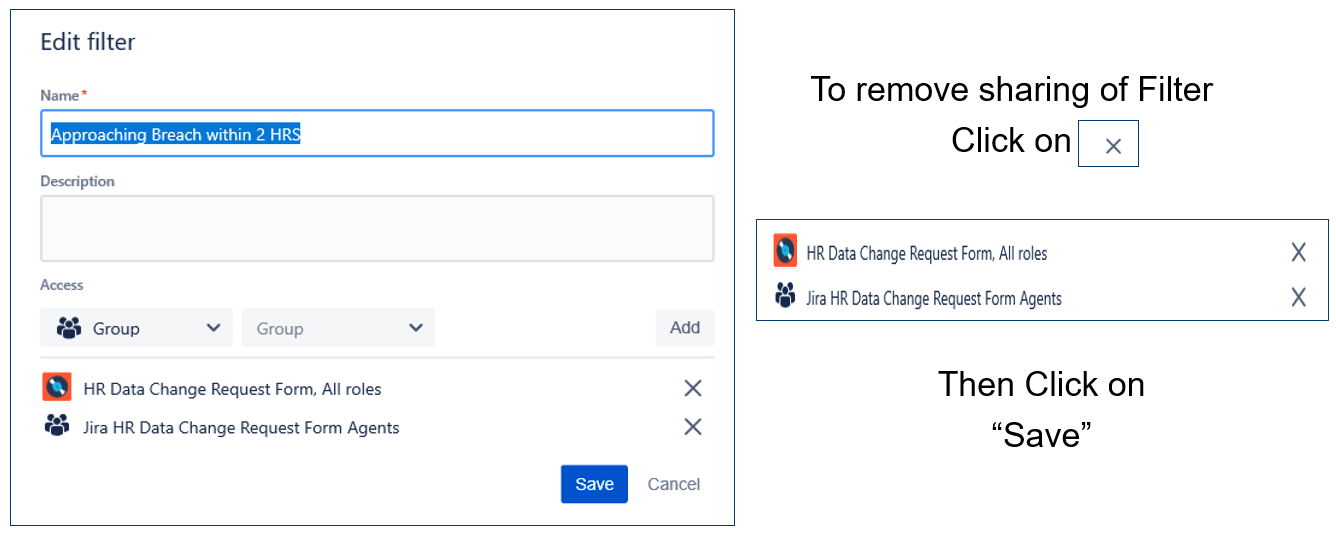
How to remove a filter which has been shared with Project or Individual ?
Finally towards Dashboard Creation once we are done with Filters
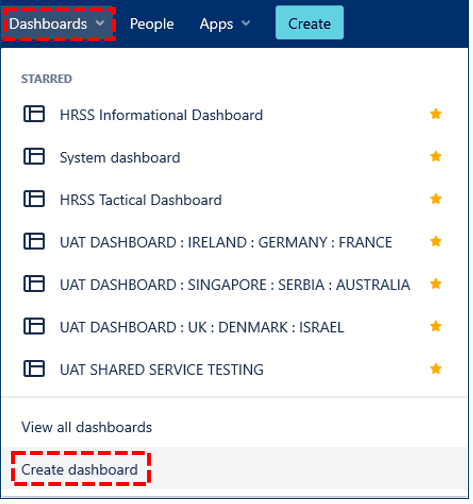
Clicking on the Option Dashboard from Quick Access Tool Bar, the following dropdown would be displayed
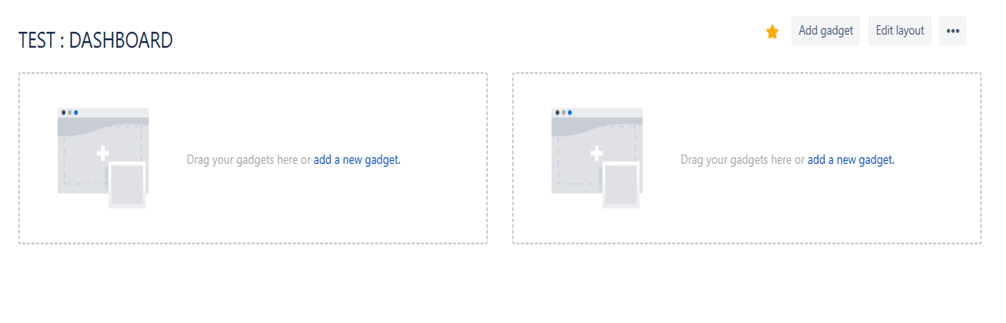
By clicking on Create Dashboard, JIRA takes to the view where the dashboards would be picked from
Need to name the dashboard as its mandatory field and the Description is an optional field
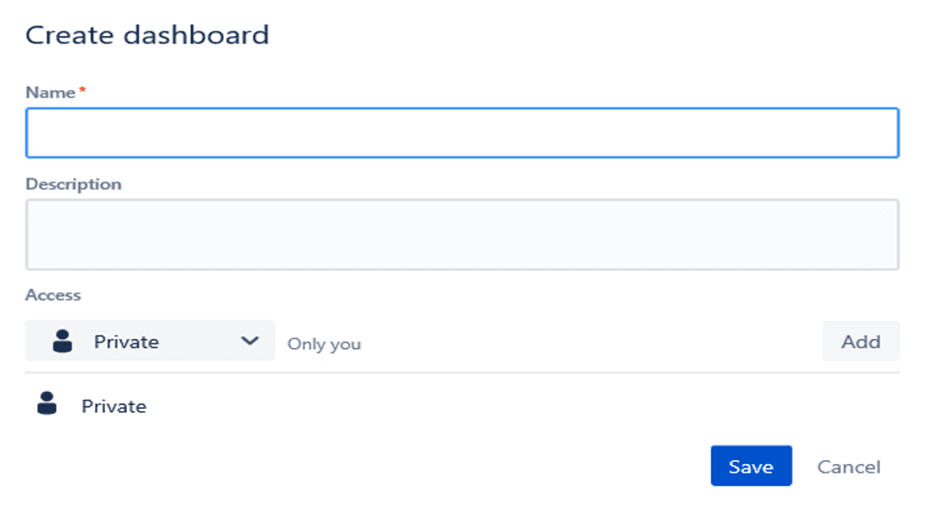
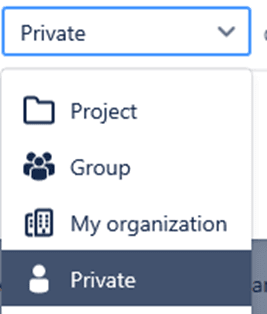
JIRA allows to share the Dashboard with the Project you are working on, Group of members, My organisation and also option to keep that private only for your use, so that they can access the Dashboard but only the creator of the Dashboard will have the access to edit and rest will have only view only access.
Dashboard can be shared with Project, Groups, My Organization, Private or with Individual
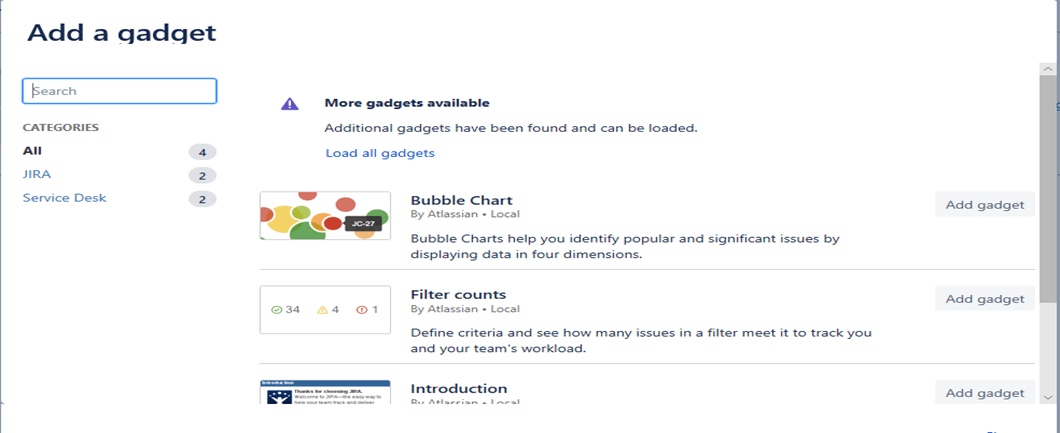
Click on ADD GAGET, where Jira displays all the available Graph and tools to build Dashboard
Click on Load All Gadgets, Jira would display all the dashboards, pick which suits the best for the requirement.
Click on Add Gadget and close the screen and go back to dashboard and have a check
Once you select the gadget, you can use the filter which you have created and pass on the data. Search for Filter which has been created, apply the same. Clicking on the options on the Graph fields, You would receive the various parameters which has been used in the project and which would add up for the Dashboard inputs and drill down

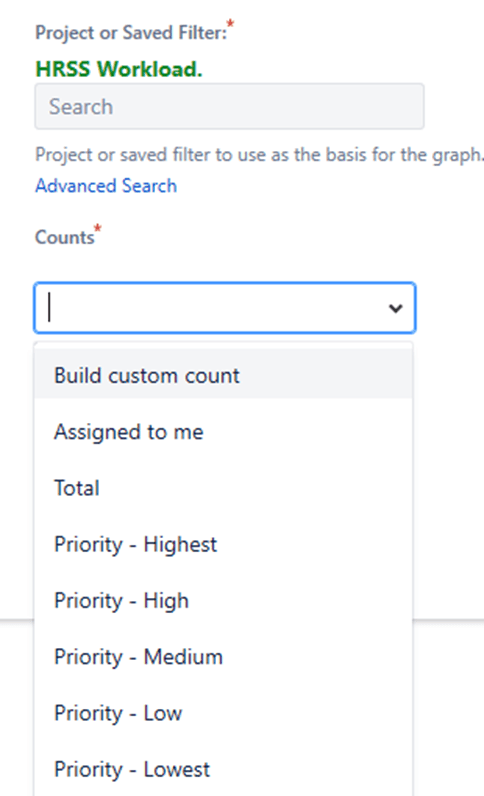
Once done with the selection, Click on “SAVE”
Dashboard is Ready