Create a Chart:
Select the cell range that contains the data you want to chart. Click the Insert tab on the ribbon. Click a chart type button in the Charts group and select the chart you want to insert.
Move or Resize a Chart:
Select the chart. Place the cursor over the chart’s border and, with the 4- headed arrow showing, click and drag to move it. Or, click and drag a sizing handle to resize it.
Change the Chart Type:
Select the chart and click the Design tab. Click the Change Chart Type button and select a different chart.
Filter a Chart:
With the chart you want to filter selected, click the Filter button next to it. Deselect the items you want to hide from the chart view and click the Apply button.
Position a Chart’s Legend:
Select the chart, click the Chart Elements button, click the Legend button, and select a position for the legend.
Show or Hide Chart Elements:
Select the chart and click the Chart Elements button. Then, use the check boxes to show or hide each element.
Insert a Trendline:
Select the chart where you want to add a trendline. Click the Design tab on the ribbon and click the Add Chart Element button. Select Trendline from the menu.
Insert a Sparkline:
Select the cells you want to summarize. Click the Insert tab and select the sparkline you want to insert. In the Location Range field, enter the cell or cell range to place the sparkline and click OK.
Create a Dual Axis Chart:
Select the cell range you want to chart, click the Insert tab, click the Combo button, and select a combo chart type.
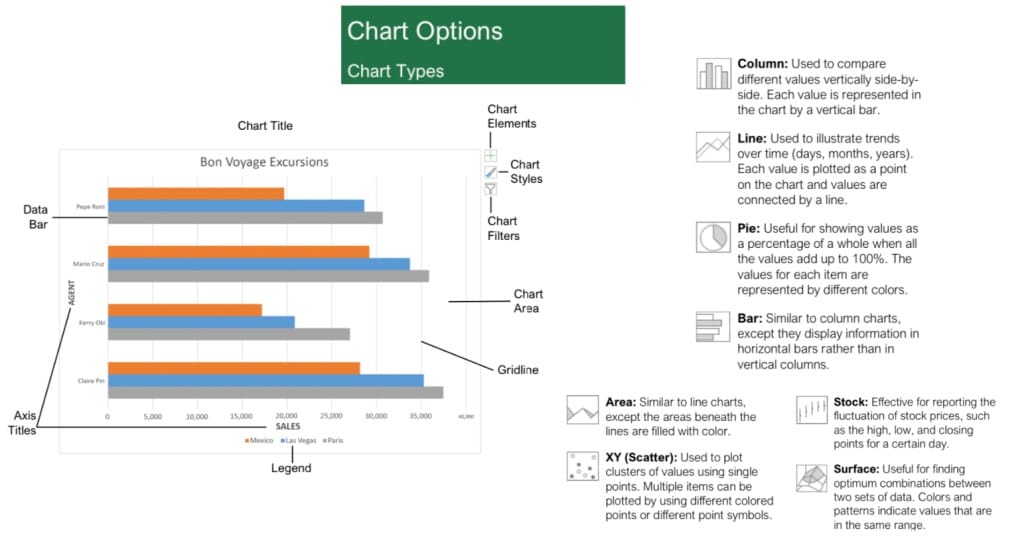
ADDITIONAL CHART ELEMENTS
Data Labels:
Display values from the cells of the worksheet on the plot area of the chart.
Data Table:
A table added next to the chart that shows the worksheet data the chart is illustrating.
Error Bars:
Help you quickly identify standard deviations and error margins.
Trend line :
Identifies the trend of the current data, not actual values. Can also identify forecasts for future data.
PIVOT
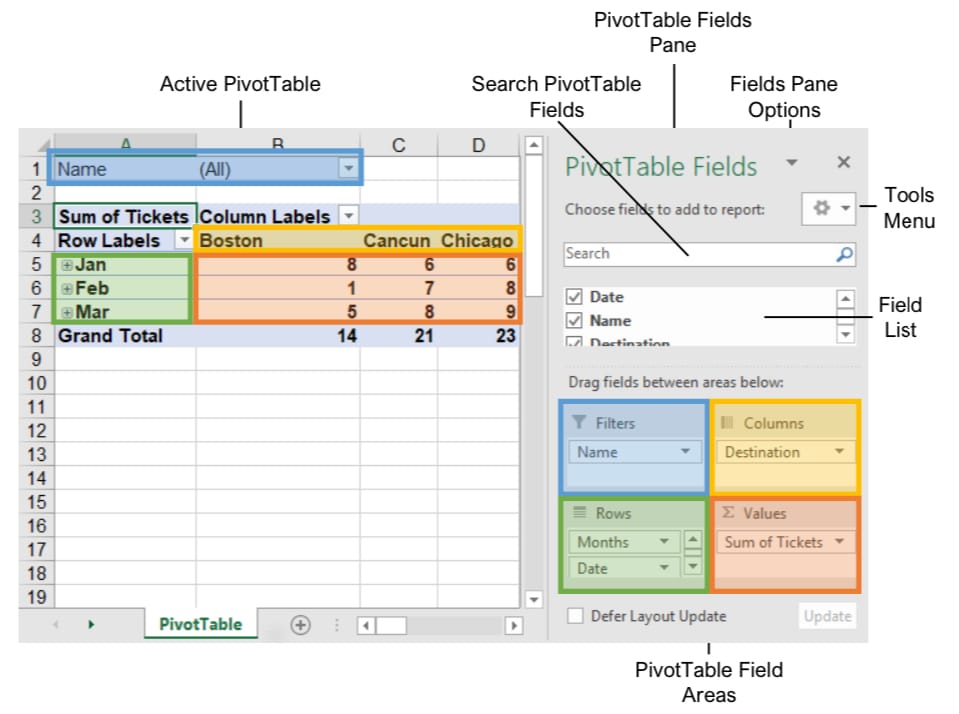
The PivotTable Fields pane controls how data is represented in the PivotTable. Click anywhere in the PivotTable to activate the pane. It includes a Search field, a scrolling list of fields (these are the column headings in the data range used to create the PivotTable), and four areas in which fields are placed. These four areas include:
Filters:
If a field is placed in the Filters area, a menu appears above the PivotTable. Each unique value from the field is an item in the menu, which can be used to filter PivotTable data.
Column Labels:
The unique values for the fields placed in the Columns area appear as column headings along the top of the PivotTable.
Row Labels:
The unique values for the fields placed in the Rows area appear as row headings along the left side of the PivotTable.
Values:
The values are the “meat” of the PivotTable, or the actual data that’s calculated for the fields placed in the rows and/or columns area. Values are most often numeric calculations.
Not all PivotTables will have a field in each area, and sometimes there will be multiple fields in a single area.
PIVOT CHARTS
Create a PivotChart:
Click any cell in a PivotTable and click the Analyze tab on the ribbon. Click the PivotChart button in the Tools group. Select a PivotChart type and click OK.
Modify PivotChart Data:
Drag fields into and out of the field areas in the task pane.
Refresh a PivotChart:
With the PivotChart selected, click the Analyze tab on the ribbon. Click the Refresh button in the Data group.
Modify PivotChart Elements:
With the PivotChart selected, click the Design tab on the ribbon. Click the Add Chart Element button in the Chart Elements group and select the item(s) you want to add to the chart.
Apply a PivotChart Style:
Select the PivotChart and click the Design tab on the ribbon. Select a style from the gallery in the Chart Styles group.
Update Chart Type:
With the PivotChart selected, click the Design tab on the ribbon. Click the Change Chart Type button in the Type group. Select a new chart type and click OK.
Enable PivotChart Drill Down:
Click the Analyze tab. Click the Field Buttons list arrow in the Show/Hide group and select Show Expand/Collapse Entire Field Buttons.
PIVOT TABLES
Create a PivotTable:
Select the data range to be used by the PivotTable.
Click the Insert tab on the ribbon and click the PivotTable button in the Tables group. Verify the range and then click OK.
Add Multiple PivotTable Fields:
Click a field in the field list and drag it to one of the four PivotTable areas that contains one or more fields.
Filter PivotTables:
Click and drag a field from the field list into the Filters area. Click the field’s list arrow above the PivotTable and select the value(s) you want to filter.
Group PivotTable Values:
Select a cell in the PivotTable that contains a value you want to group by. Click the Analyze tab on the ribbon and click the Group Field button. Specify how the PivotTable should be grouped and then click OK.
Refresh a PivotTable:
With the PivotTable selected, click the Analyze tab on the ribbon. Click the Refresh button in the Data group.
Format a PivotTable:
With the PivotTable selected, click the Design tab. Then, select desired formatting options from the PivotTable Options group and the PivotTable Styles group
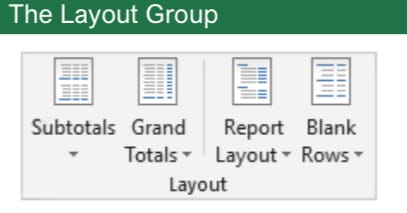
PIVOT LAYOUT GROUP
Subtotals:
Show or hide subtotals and specify their location in the PivotTable.
Grand Totals:
Add or remove grand total rows for columns and/or rows.
Report Layout:
Adjust the report layout to show in compact, outline, or tabular form.
Blank Rows:
Emphasize groups of data by manually adding blank rows between grouped items.